Virtio/Block/Latency
This page describes how virtio-blk latency can be measured. The aim is to build a picture of the latency at different layers of the virtualization stack for virtio-blk.
Benchmarks
Single-threaded read or write benchmarks are suitable for measuring virtio-blk latency. The guest should have 1 vcpu only, which simplifies the setup and analysis.
Tools
Linux kernel tracing (ftrace and trace events) can instrument host and guest kernels. This includes finding system call and device driver latencies.
Trace events in QEMU can instrument components inside QEMU. This includes virtio hardware emulation and AIO. Trace events are not upstream as of writing but can be built from git branches.
Instrumenting the stack
Guest
The single-threaded read/write benchmark prints the mean time per operation at the end. This number is the total latency including guest, host, and QEMU. All latency numbers from layers further down the stack should be smaller than the guest number.
Guest virtio-pci
The virtio-pci latency is the time from the virtqueue notify pio write until the vring interrupt. The guest performs the notify pio write in virtio-pci code. The vring interrupt comes from the PCI device in the form of a legacy interrupt or a message-signaled interrupt.
Ftrace can instrument virtio-pci inside the guest:
cd /sys/kernel/debug/tracing
echo 'vp_notify vring_interrupt' >set_ftrace_filter
echo function >current_tracer
cat trace_pipe >/path/to/tmpfs/trace
Note that putting the trace file in a tmpfs filesystem avoids causing disk I/O in order to store the trace.
Host kvm
The kvm latency is the time from the virtqueue notify pio exit until the interrupt is set inside the guest. This number does not include vmexit/entry time.
Events tracing can instrument kvm latency on the host:
cd /sys/kernel/debug/tracing
echo 'port == 0xc090' >events/kvm/kvm_pio/filter
echo 'gsi == 26' >events/kvm/kvm_set_irq/filter
echo 1 >events/kvm/kvm_pio/enable
echo 1 >events/kvm/kvm_set_irq/enable
cat trace_pipe >/tmp/trace
Note how kvm_pio and kvm_set_irq can be filtered to only trace events for the relevant virtio-blk device. Use lspci -vv -nn and cat /proc/interrupts inside the guest to find the pio address and interrupt.
QEMU virtio
The virtio latency inside QEMU is the time from virtqueue notify until the interrupt is raised. This accounts for time spent in QEMU servicing I/O.
- Run with 'simple' trace backend, enable virtio_queue_notify() and virtio_notify() trace events.
- Use ./simpletrace.py trace-events /path/to/trace to pretty-print the binary trace.
- Find vdev pointer for correct virtio-blk device in trace (should be easy because most requests will go to it).
- Use qemu_virtio.awk only on trace entries for the correct vdev.
QEMU paio
The paio latency is the time spent performing pread()/pwrite() syscalls. This should be similar to latency seen when running the benchmark on the host.
- Run with 'simple' trace backend, enable the posix_aio_process_queue() trace event.
- Use ./simpletrace.py trace-events /path/to/trace to pretty-print the binary trace.
- Only keep reads (type=0x1 requests) and remove vm boot/shutdown from the trace file by looking at timestamps.
- Use qemu_paio.py to calculate the latency statistics.
Results
Host
The host is 2x4-cores, 8 GB RAM, with 12 LVM striped FC LUNs. Read and write caches are enabled on the disks.
The host kernel is kvm.git 37dec075a7854f0f550540bf3b9bbeef37c11e2a from Sat May 22 16:13:55 2010 +0300.
The qemu-kvm is 0.12.4 with patches as necessary for instrumentation.
Guest
The guest is a 1 vcpu, x2apic, 4 GB RAM virtual machine running a 2.6.32-based distro kernel. The root disk image is raw and the benchmark storage is an LVM volume passed through as a virtio disk with cache=none.
Latency
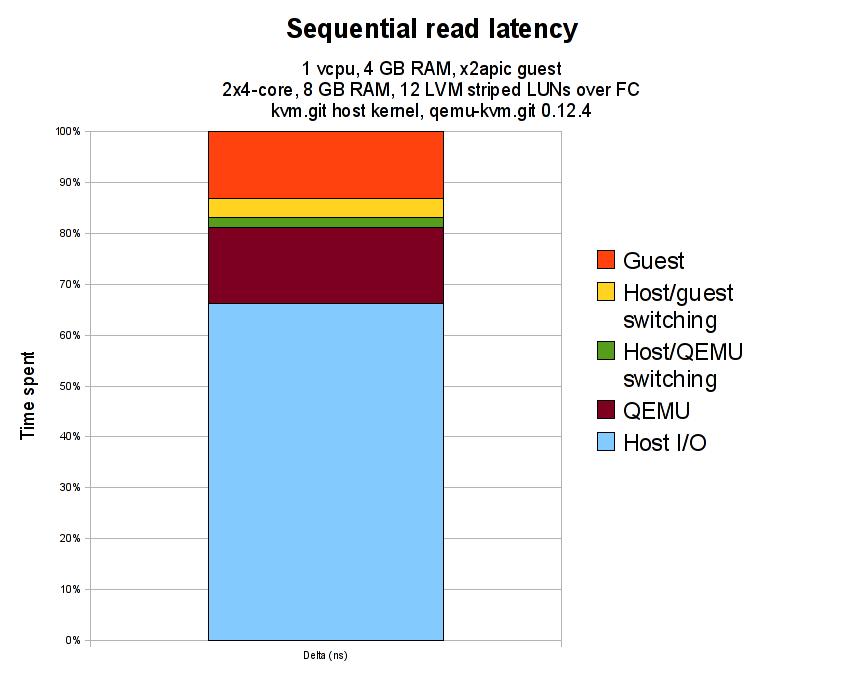
The following diagram shows the time spent in the different layers of the virtualization stack:
Here is the raw data used to plot the diagram:
| Layer | Latency (ns) | Delta (ns) | Guest benchmark control (ns) |
|---|---|---|---|
| Guest benchmark | 196528 | ||
| Guest virtio-pci | 170829 | 25699 | 202095 |
| Host kvm.ko | 163268 | 7561 | |
| QEMU virtio | 159628 | 3640 | 205165 |
| QEMU paio | 130235 | 29393 | 202777 |
| Host benchmark | 128862 |
The Delta (ns) column is the time between two layers, e.g. Guest benchmark and Guest virtio-pci. The delta time tells us how long is being spent in a layer of the virtualization stack.
The Guest benchmark control (ns) column is the latency reported by the guest benchmark for that run. It is useful for checking that overall latency has remained relatively similar across benchmarking runs.
